Welcome to my Portfolio!
I am Troy Ascher and this is my Portfolio. On this page I have images from projects that I’ve been working on recently. Other examples of visualizations and code I have written are in the R, SQL, and Python sections of the website. My professional resume is available HERE.
Projects
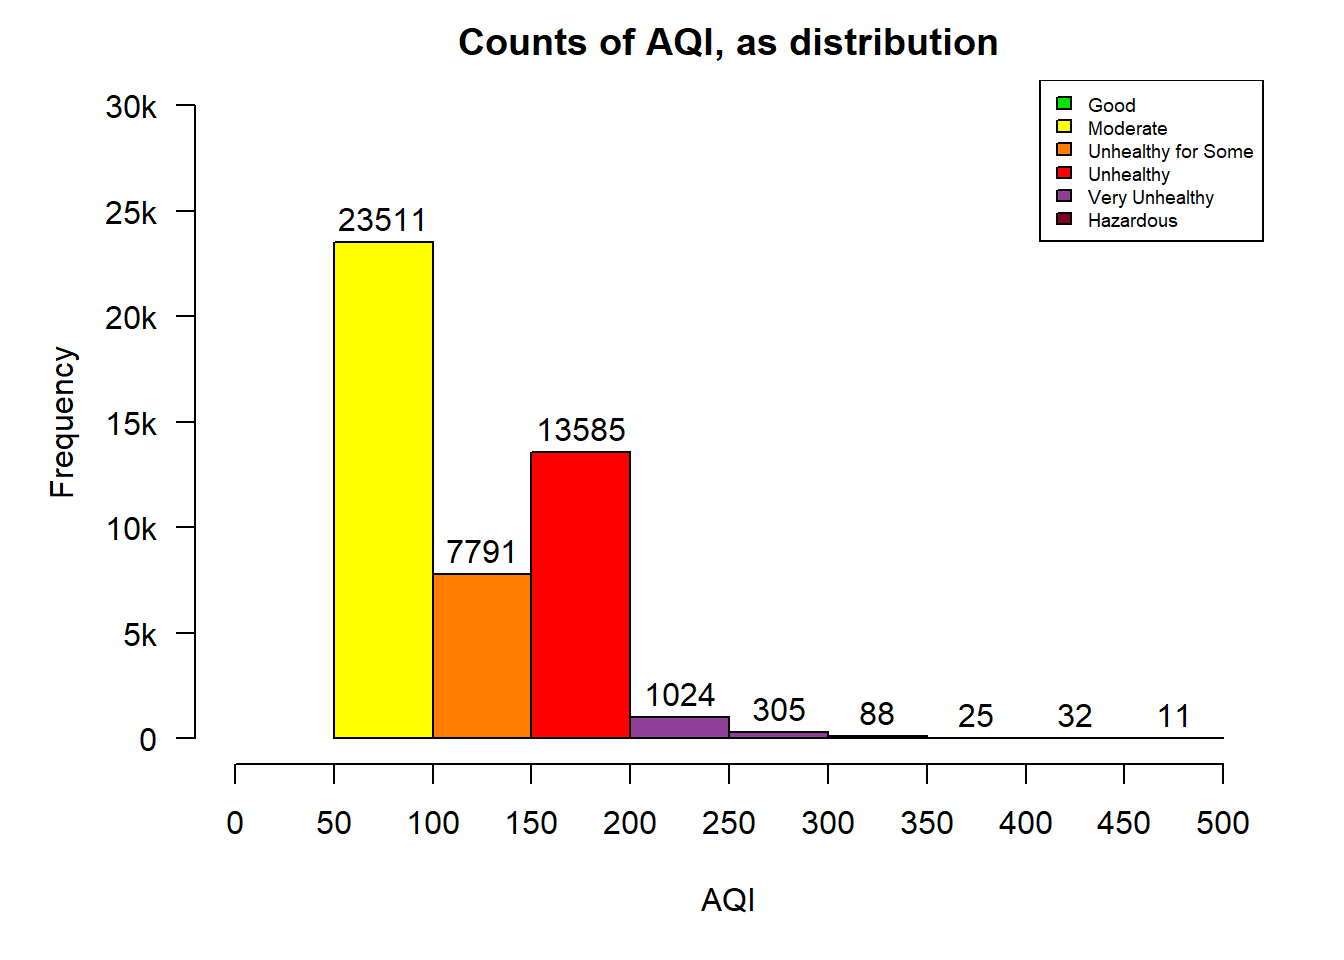
Beijing AQI
These visualizations are from a project I did as part of Master’s in Computer Information Systems from Boston University. View the whole project HERE.
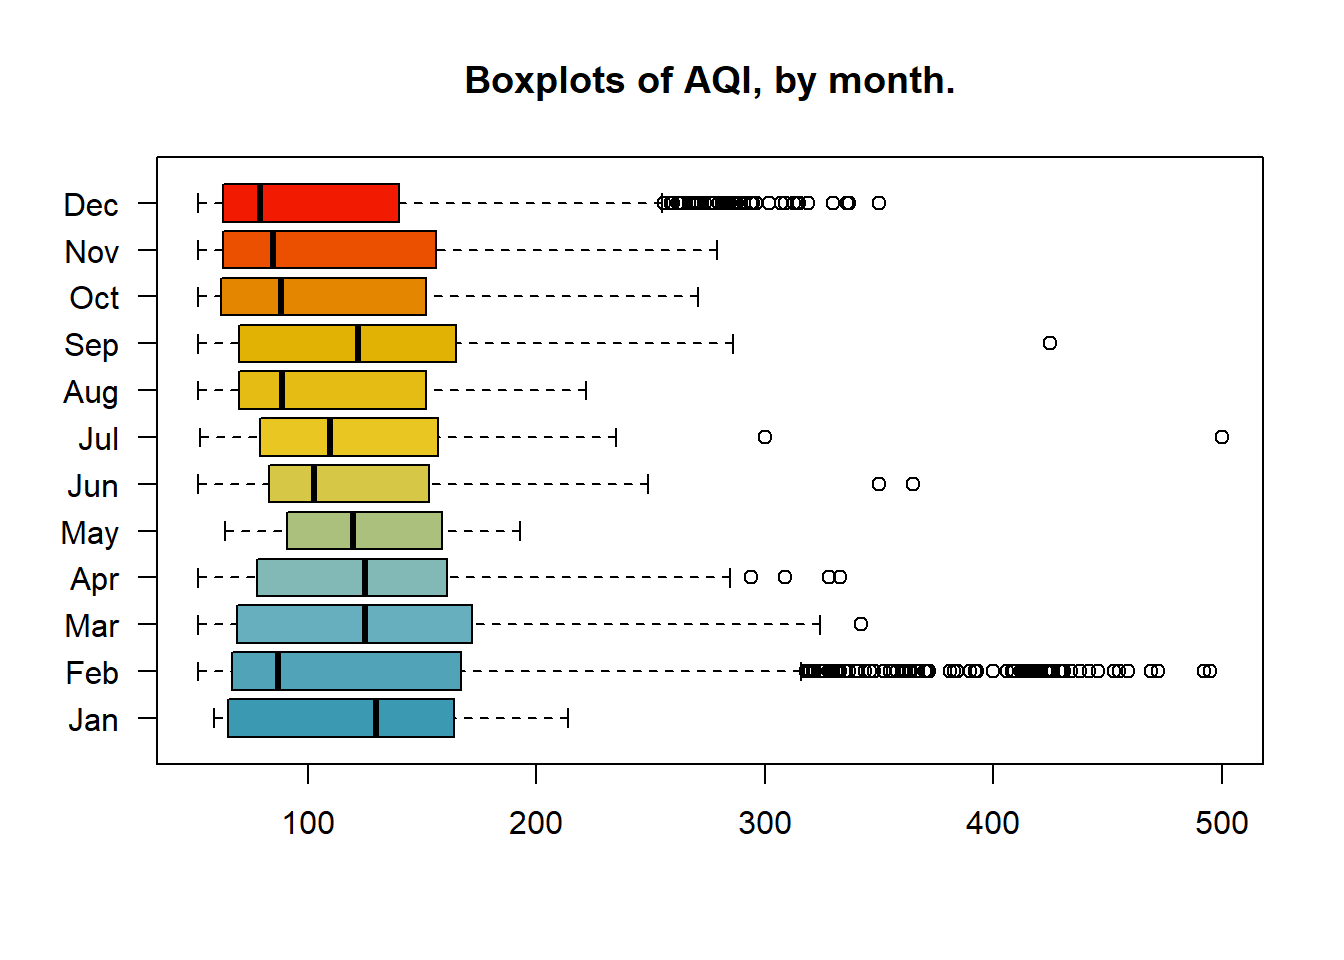
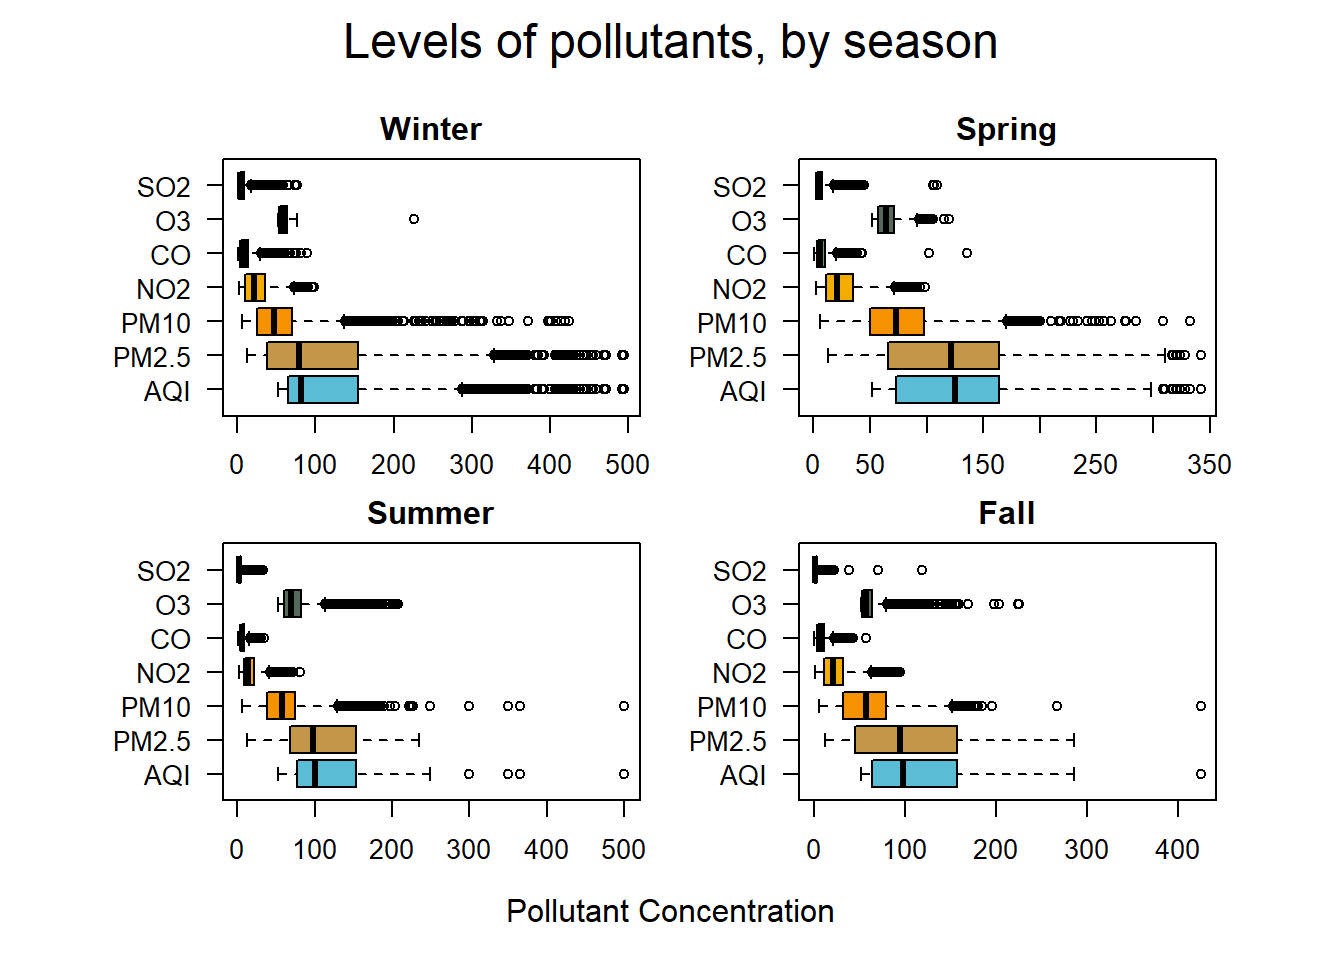
Beijing AQI Distribution, 2017, by month and season
API Practice
This visualization is from a self-study I did on using APIs in RStudio with ggplot2. View my process HERE.
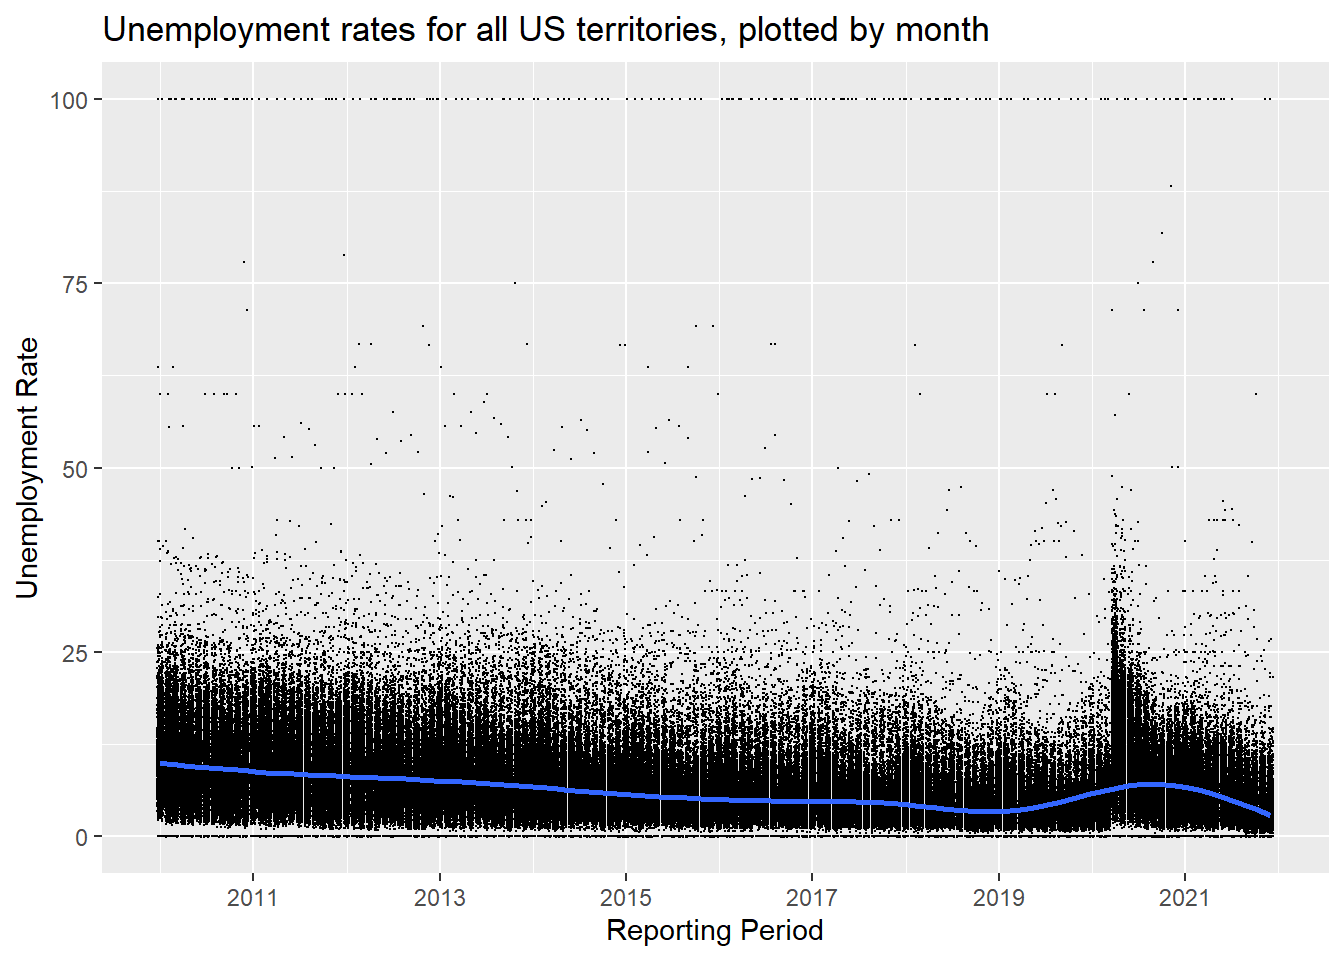
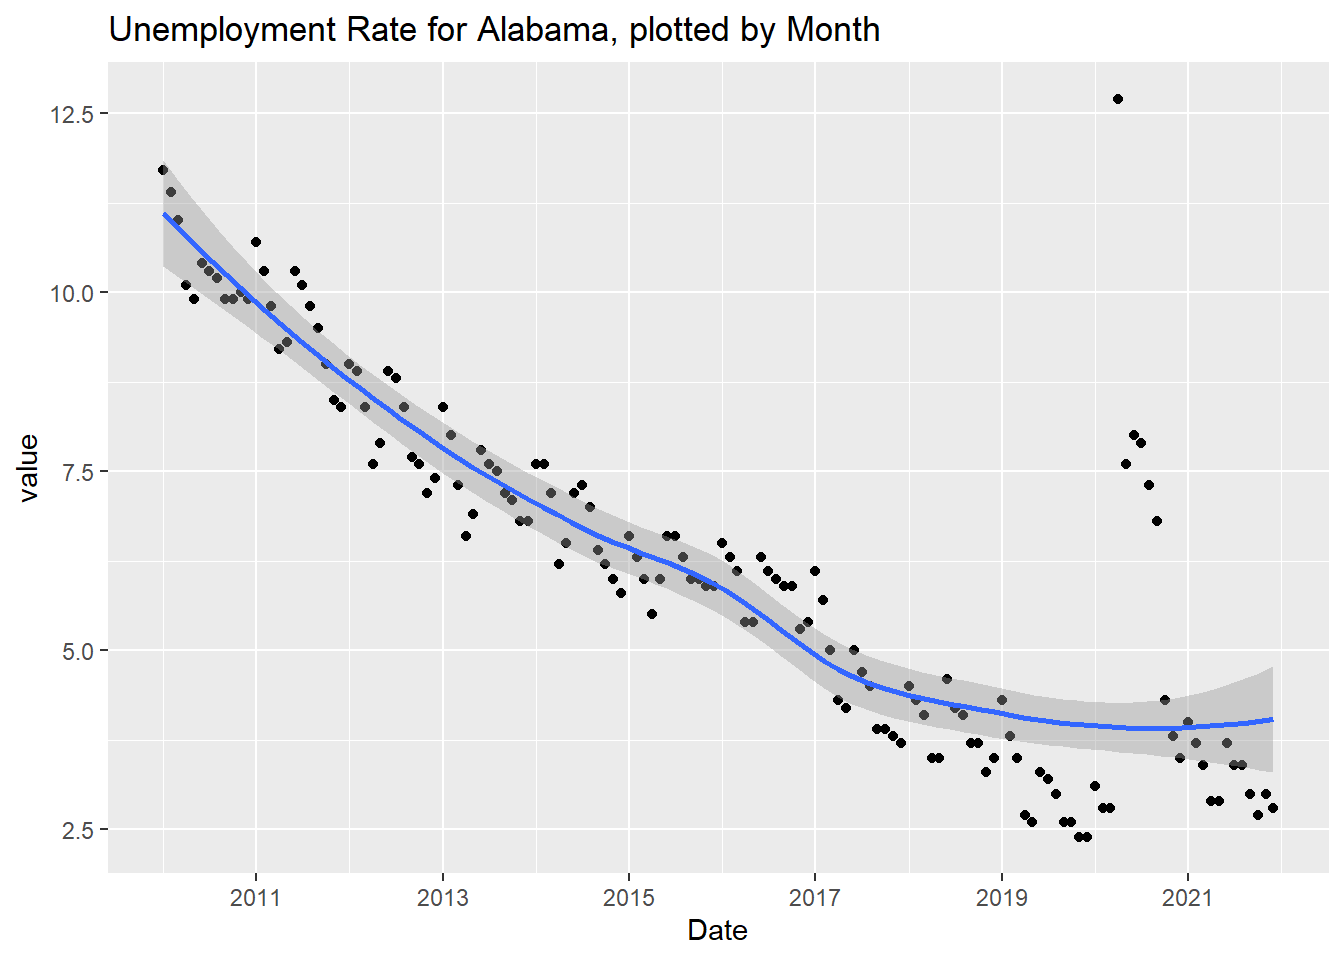
US Unemployment Rates
Beijing Weather
These visualizations are from a project I did as part of Master’s in Computer Information Systems from Boston University. View the whole project HERE.
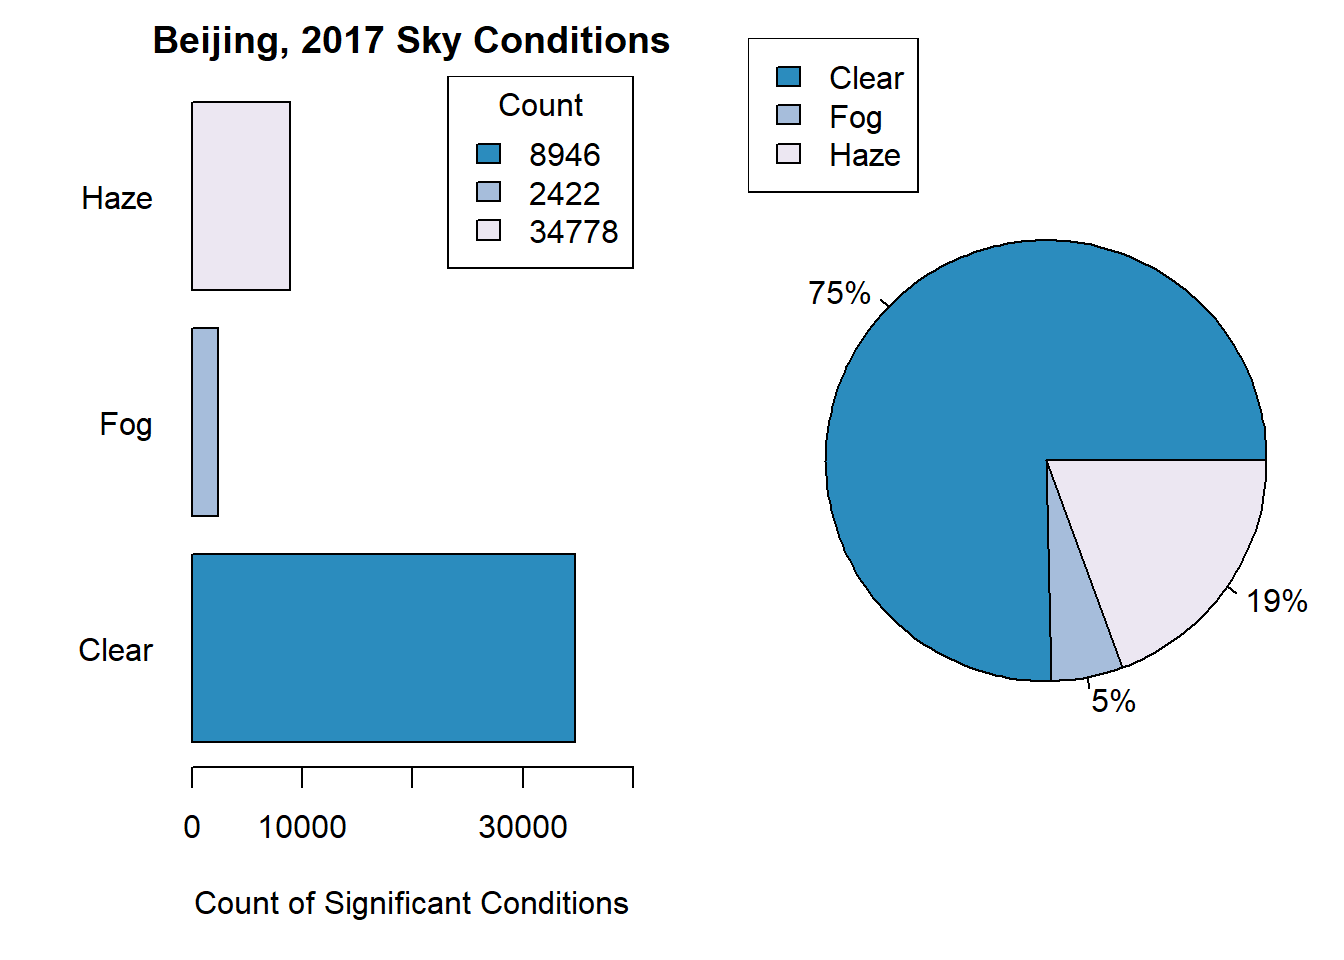
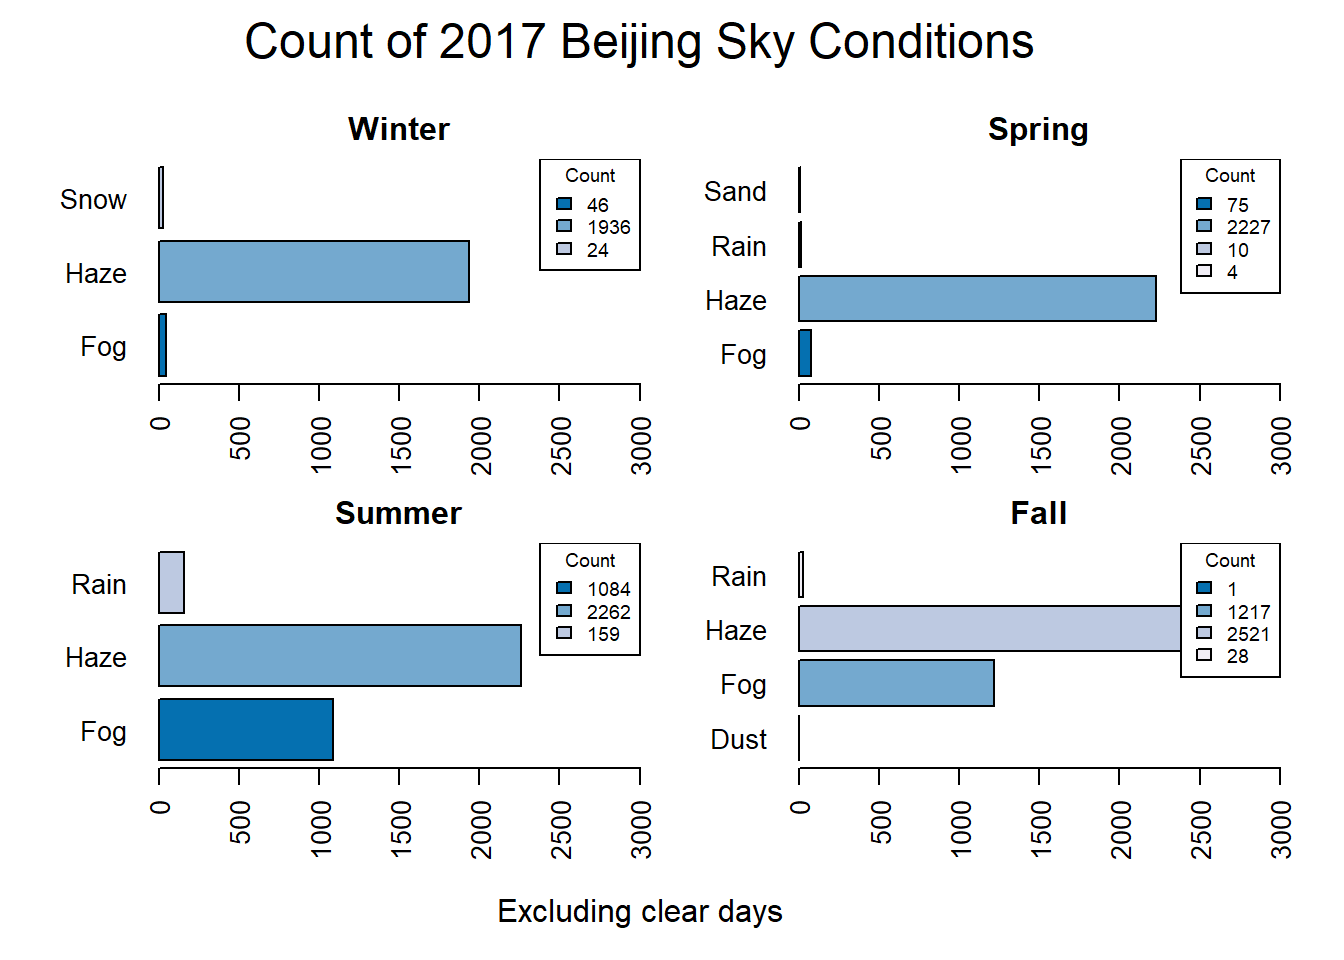
Beijing weather conditions, including and excluding clear days
Beijing AQI & Wind
These visualizations are from a project I did as part of Master’s in Computer Information Systems from Boston University. View the whole project HERE.
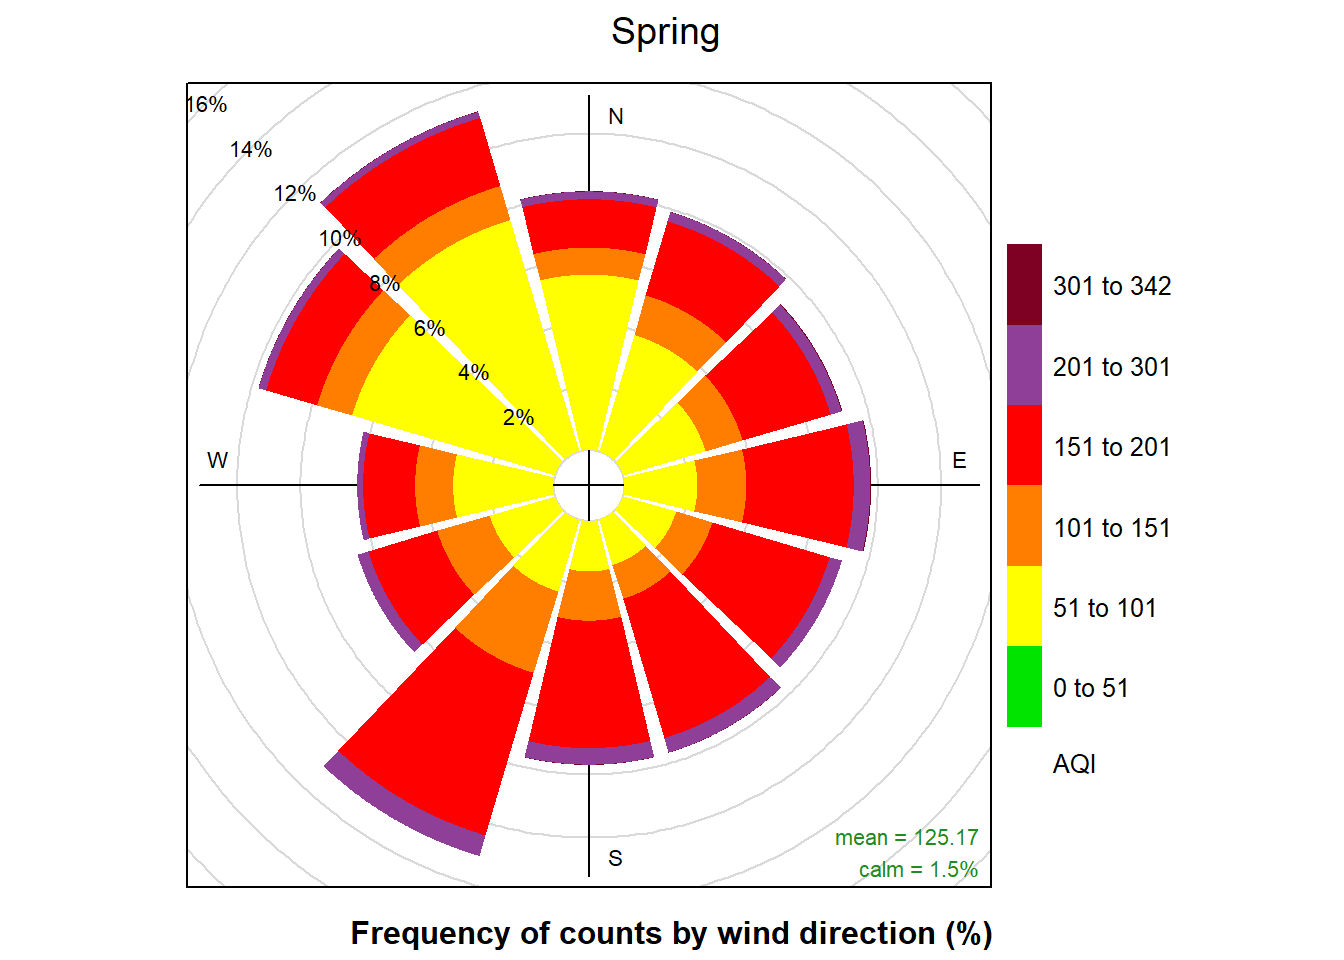
Beijing AQI Data from 2017 using US EPA color coding system